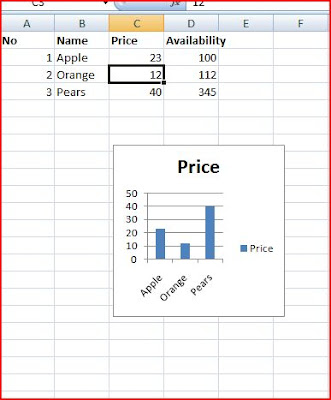
Excel has default chart (might be bar chart). The following code just creates the same using available data
 Excel ChartWizard Output
Sub Add_Default_Chart_2003()
Dim oChts As ChartObjects '* Chart Object Collection
Dim oCht As ChartObject '* Chart Object
Dim oWS As Worksheet '* WorkSheet
On Error GoTo Err_Chart
oWS = ActiveSheet
oChts = oWS.ChartObjects
oCht = oChts.Add(100, 100, 150, 150)
oCht.Chart.ChartWizard(oWS.Range("B1", "C4"))
' Release/Dispose Objects
If Not oCht Is Nothing Then oCht = Nothing
If Not oChts Is Nothing Then oChts = Nothing
If Not oWS Is Nothing Then oWS = Nothing
Exit Sub
Err_Chart:
MsgBox(Err.Number & " - " & Err.Description)
Err.Clear()
Resume Next
End Sub


No comments:
Post a Comment